School administrators evaluating interactive touchscreen displays often find themselves reviewing static product photos, technical specifications, and feature lists—but these materials rarely show how the technology actually functions in real school environments. Watching someone interact with a touchscreen recognition display reveals far more than specifications ever could about user experience, navigation patterns, and the genuine engagement these systems create.
Yet comprehensive walkthroughs demonstrating actual touchscreen interaction remain surprisingly rare in the recognition display industry. Many vendors offer polished marketing videos with quick cuts and limited hands-on demonstration, leaving decision-makers uncertain how visitors will actually use these systems once installed in school hallways, athletic lobbies, or main entrances. The gap between seeing a display and understanding how people interact with it creates hesitation during the purchasing process.
This comprehensive walkthrough guide takes you inside real interactive school touchscreen installations, demonstrating exactly how users navigate recognition content, what interaction patterns emerge naturally, and which design elements create the most engaging experiences. By observing actual touchscreen usage across different school environments, administrators gain practical insight impossible to obtain from product brochures alone.
Understanding how interactive school touchscreen displays function requires observing them in action rather than reviewing static demonstrations. Real walkthroughs reveal the natural flow of user interaction, the intuitive navigation patterns that emerge, and the content discovery behaviors that drive engagement with recognition displays.

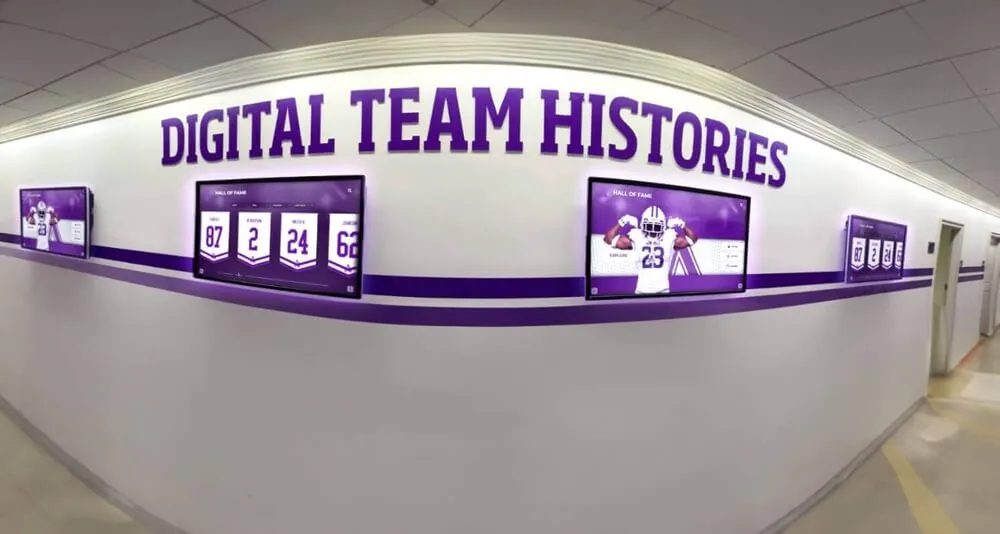
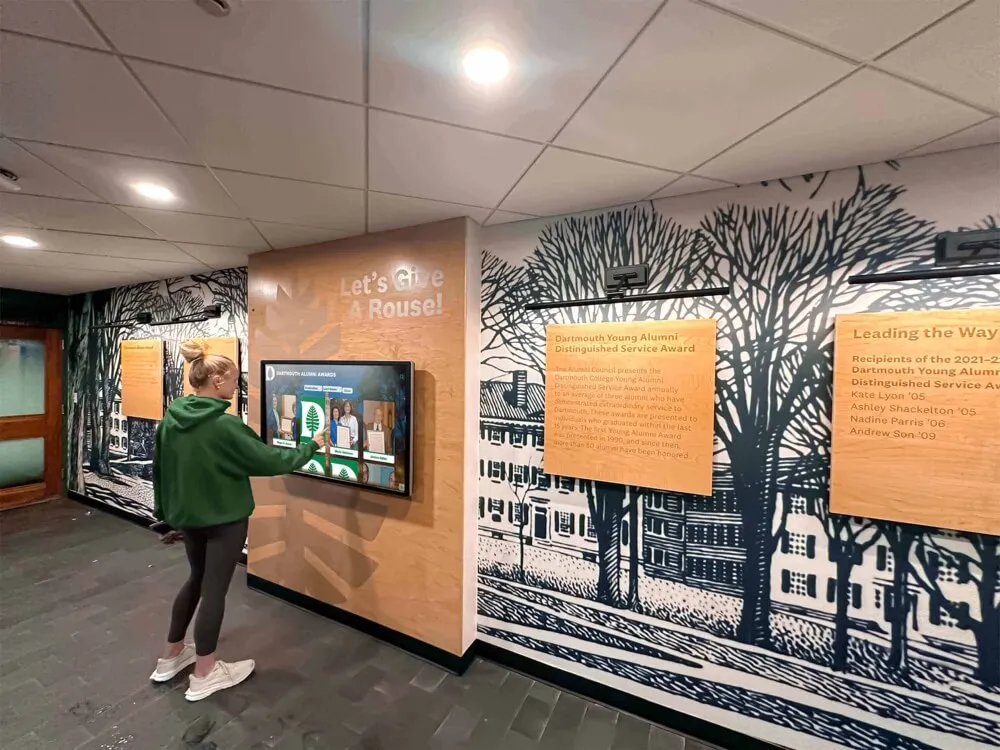
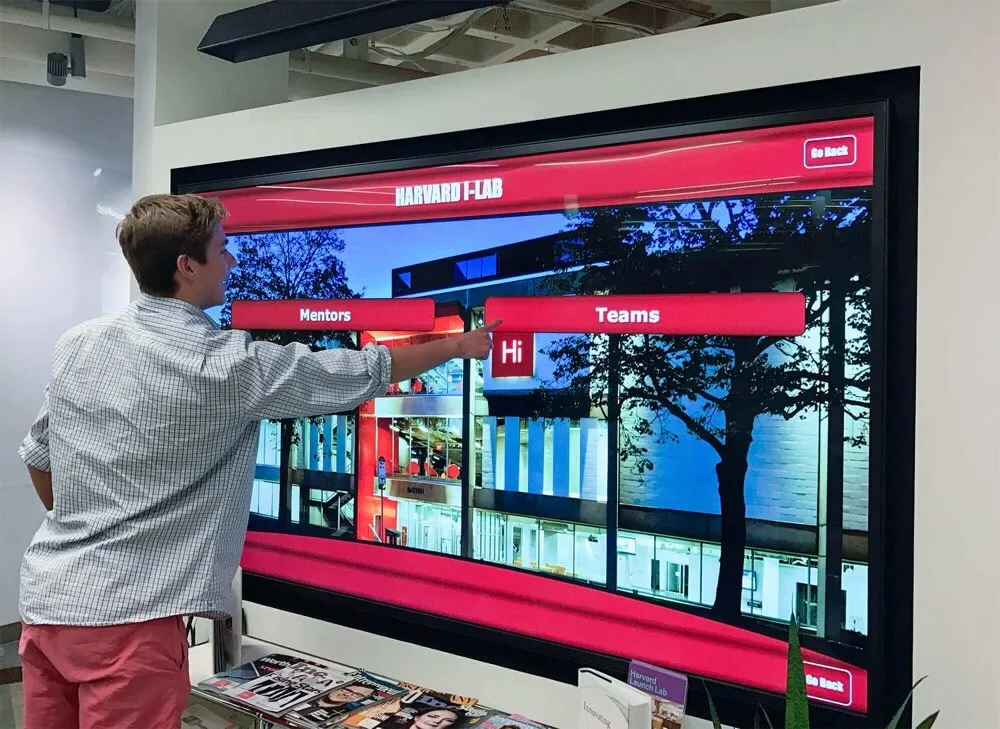
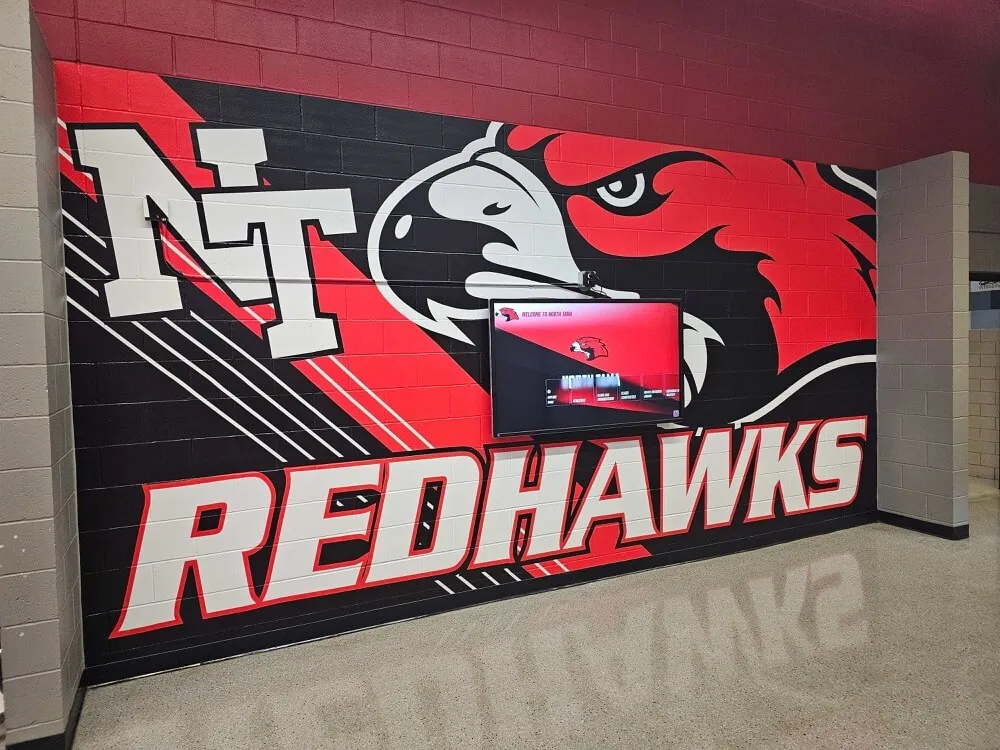
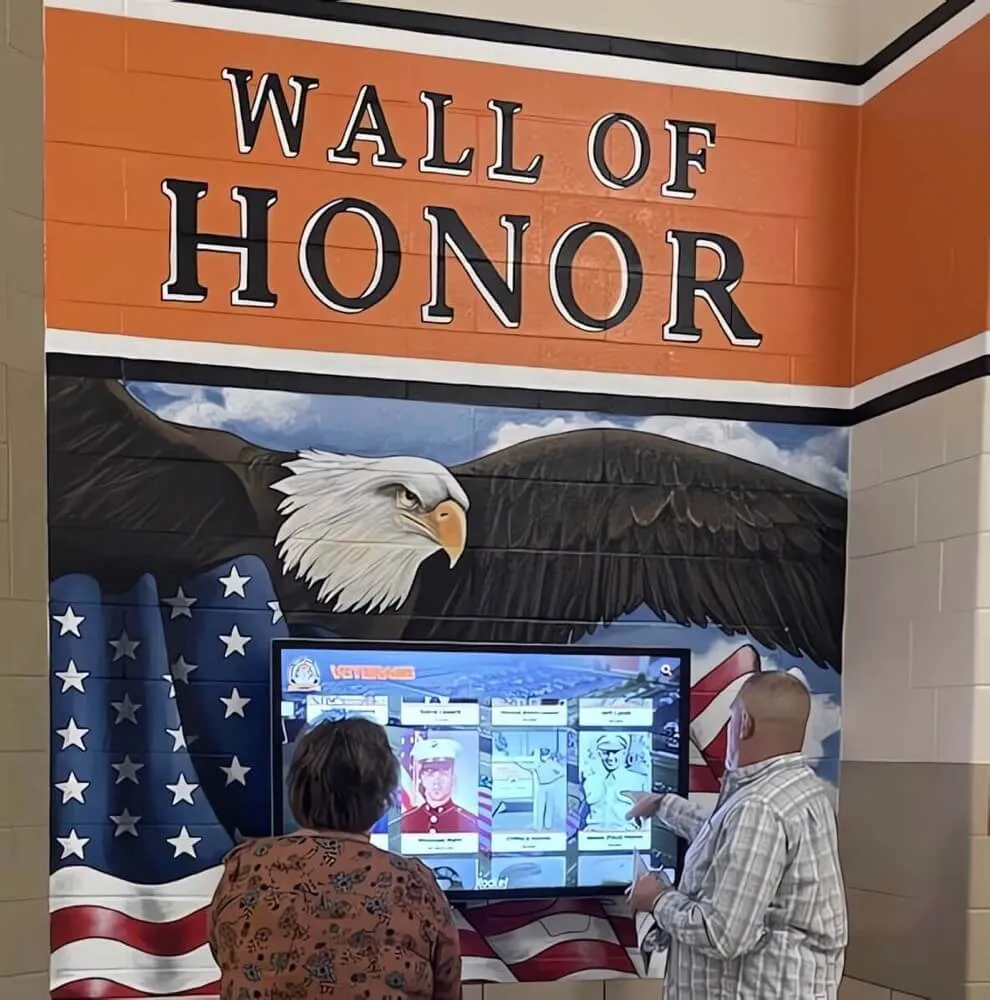
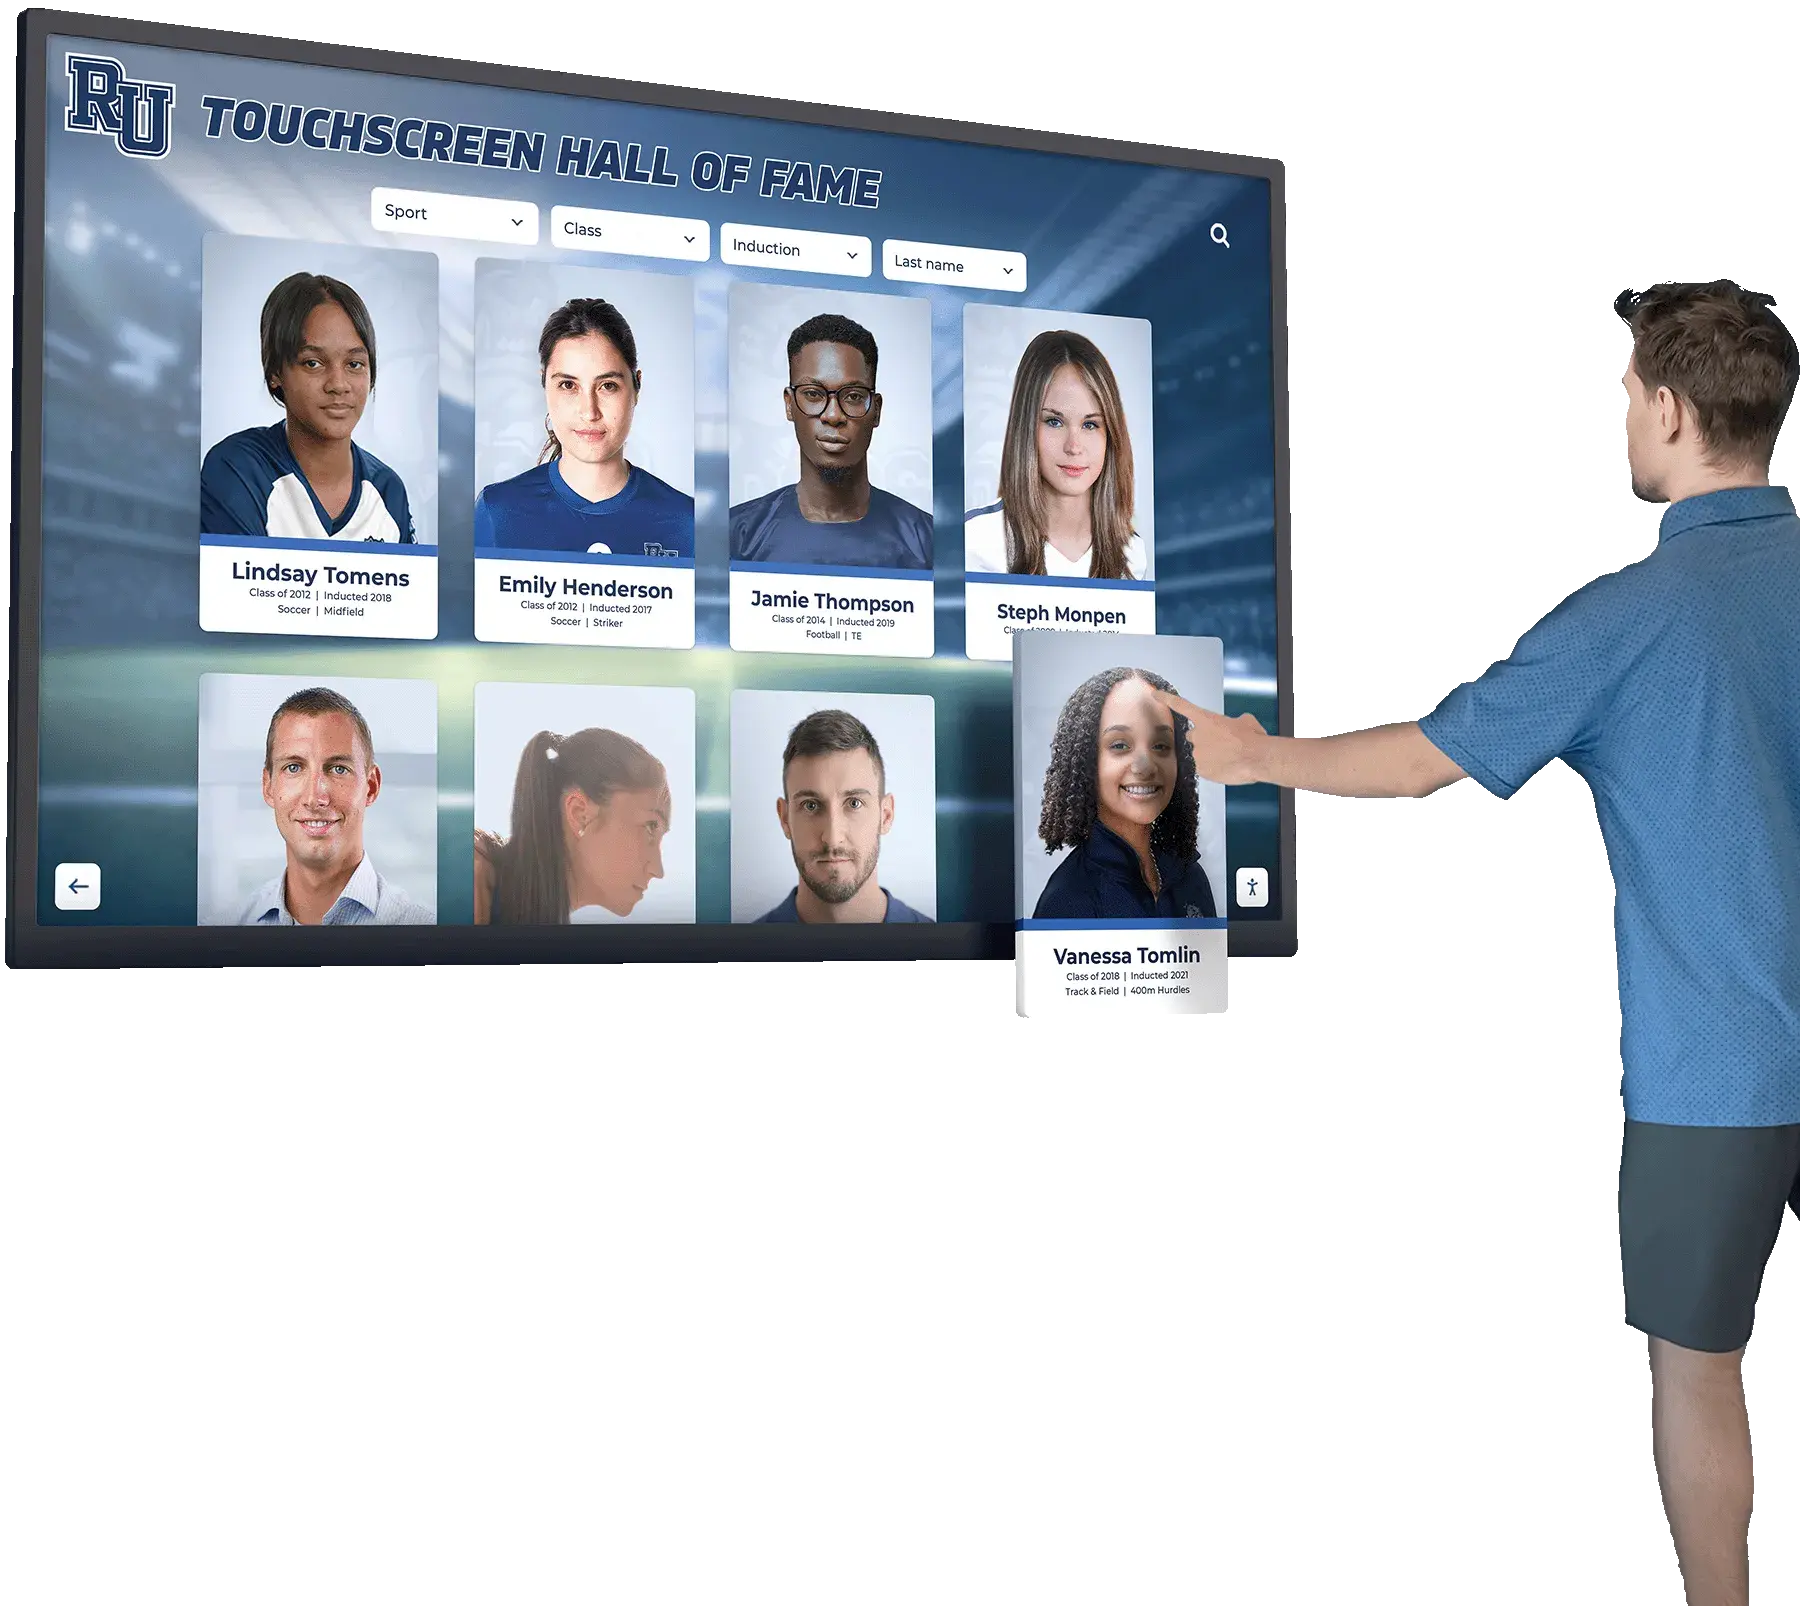
Real user interaction with touchscreen displays demonstrates how visitors naturally explore recognition content and navigate through achievement categories
The First Touch: Initial User Interaction Patterns
The moment a visitor first encounters an interactive school touchscreen reveals critical design elements that either invite engagement or create hesitation. Observing these initial interactions across dozens of installations provides insight into what works—and what doesn’t—when designing recognition displays for school environments.
The Attraction Phase
Before anyone touches the screen, the display must first attract attention in busy hallways and lobbies:
Visual Magnetism Elements
Effective touchscreen displays employ several techniques to draw initial attention:
- Large-format screens (typically 55-65 inches) commanding visual presence in hallway spaces
- High-resolution imagery showcasing student athletes, scholars, and achievement moments
- Motion elements through rotating hero images or subtle content transitions
- Strategic lighting positioning that makes screens visible without glare
- Attractive framing and mounting that signals importance and quality
Schools implementing interactive touchscreen recognition systems report that visitors often stop initially just to view rotating images before realizing the display offers interactive exploration.
The Invitation to Touch
Converting visual interest into physical interaction requires clear communication that the display responds to touch:
- Prominent “Touch to Explore” messaging visible from approaching angles
- Interface elements like buttons and navigation icons that signal interactivity
- Content previews that suggest additional information available through interaction
- Screen positioning at accessible heights (40-48 inches from floor to center)
- Responsive feedback when users hover hands near the screen
The most successful installations make touchscreen capability immediately obvious without requiring explanatory signage or instructions.
First Navigation Decisions
Once a user touches the screen, their first navigation choice reveals how well the interface design matches natural exploration patterns:
Home Screen Navigation Options
Well-designed interactive school touchscreens typically present 4-6 clear navigation pathways:
- Search functionality allowing visitors to find specific individuals by name
- Category browsing through achievement types (athletics, academics, arts, community service)
- Timeline navigation enabling exploration by year or graduating class
- Featured content highlighting recent achievements or historical milestones
- Quick links to frequently accessed sections like current year athletes or honor societies
- Team or group browsing organized by sport, club, or academic program
During walkthroughs, visitors most commonly use name search when looking for someone specific, but choose category browsing when exploring generally. Schools serving student achievement recognition needs find that both navigation styles prove equally important for different visitor types.

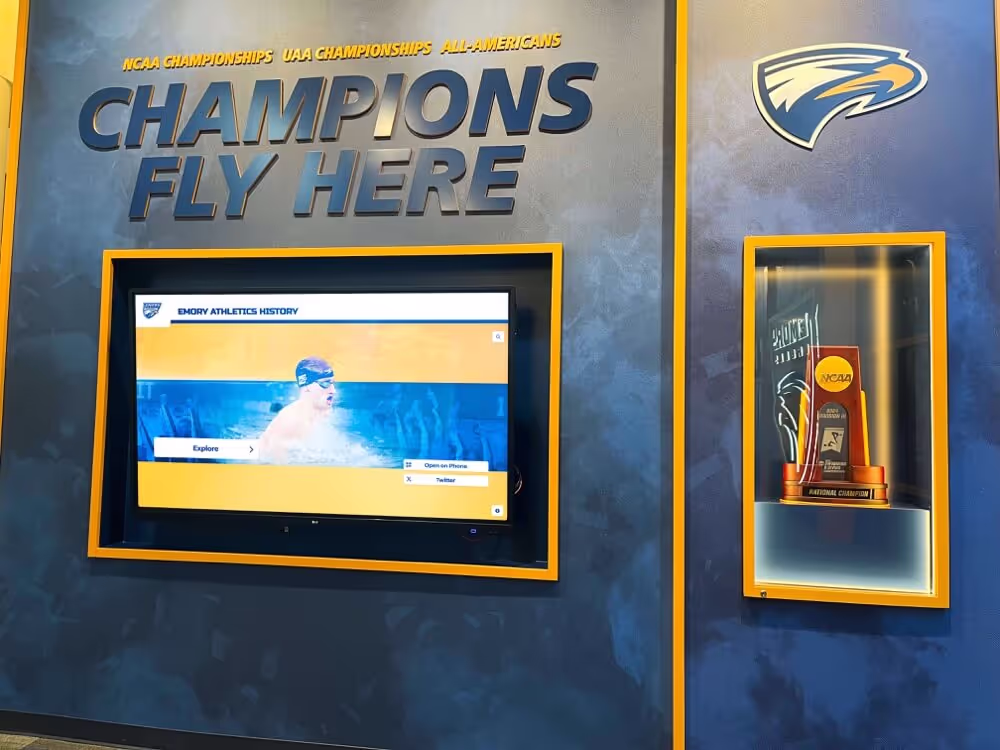
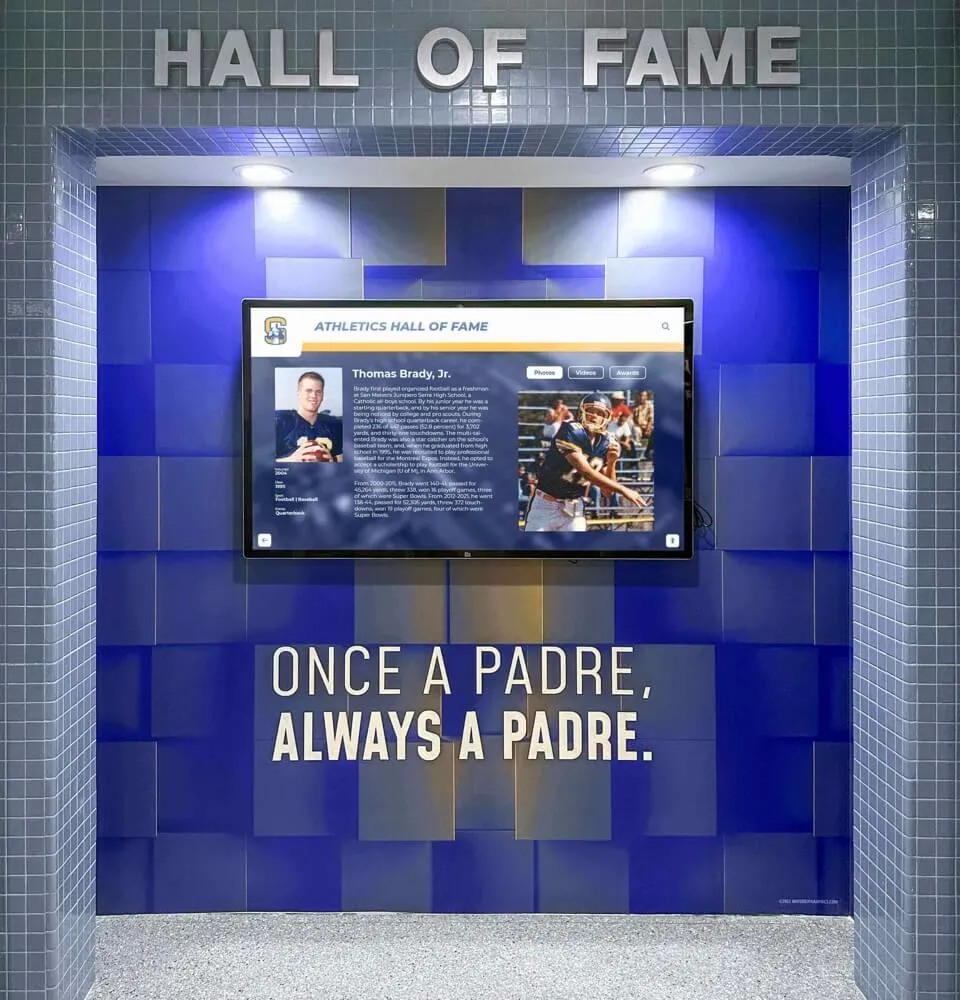
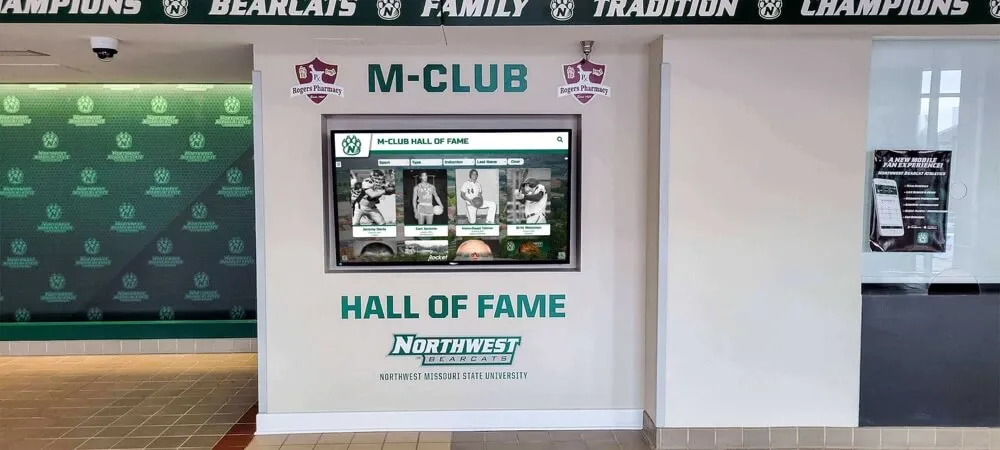
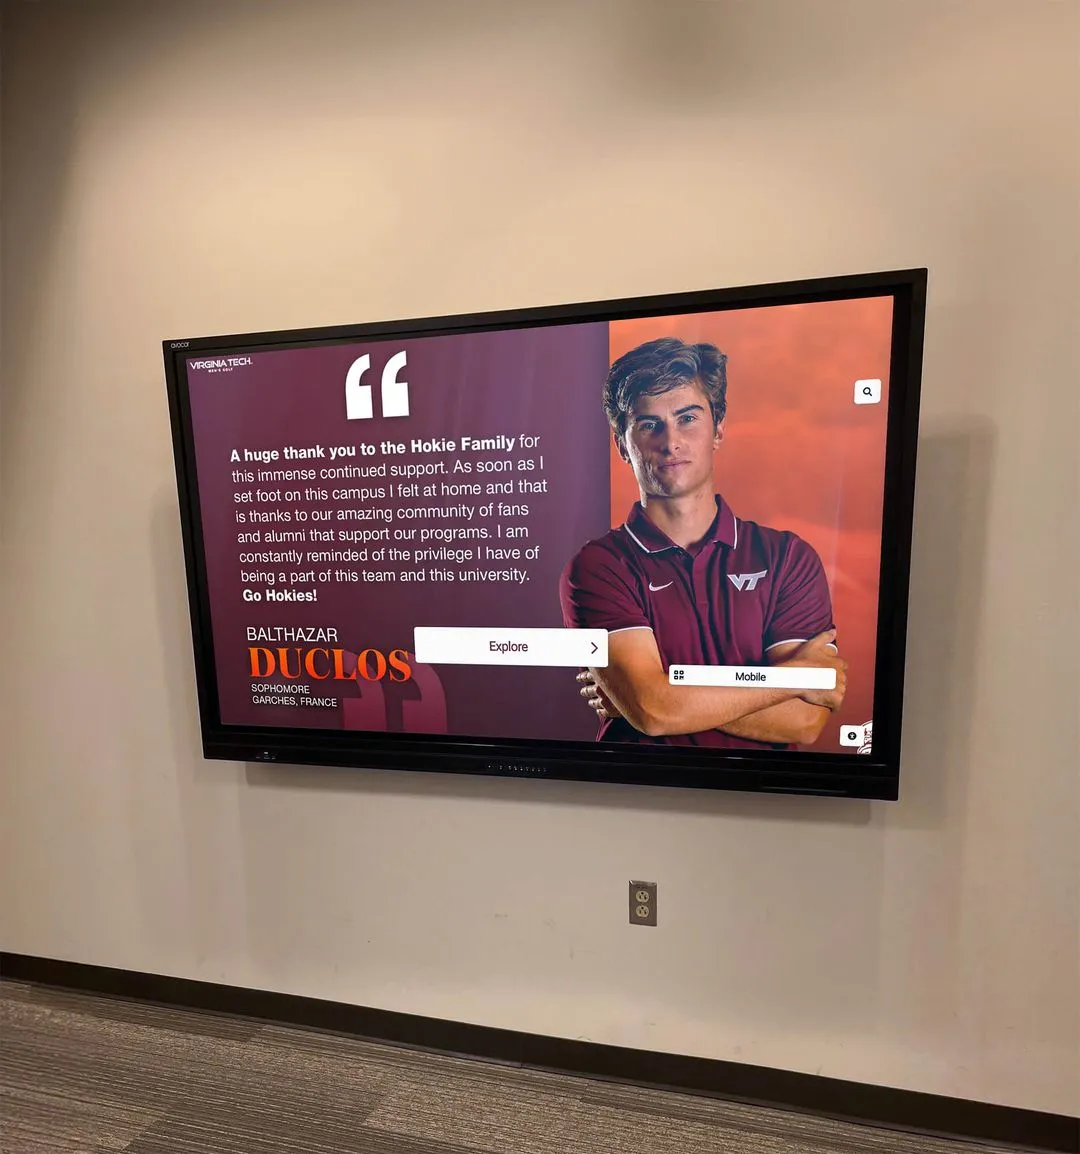
Comprehensive touchscreen walkthroughs demonstrate search functions, category browsing, and content discovery methods used by real visitors
Content Discovery Walkthroughs: How Users Explore Recognition
Watching users discover and explore content on interactive school touchscreens reveals patterns that inform effective interface design. These walkthroughs demonstrate how visitors naturally navigate through layers of recognition content, what captures their attention, and how long they engage with different content types.
The Search Journey
When visitors know exactly who they’re looking for, the search function becomes their primary interaction method:
Search Interface Interactions
Real-world search behavior on touchscreen displays follows predictable patterns:
- Users tap the search field and expect an on-screen keyboard to appear immediately
- Most visitors begin typing just the last name before considering first names
- Search results appearing dynamically as users type creates satisfying responsiveness
- Fuzzy search functionality that tolerates typos proves essential for user-friendly operation
- Clear result previews showing photos and basic information help verify the correct individual
During typical walkthroughs, search interactions take 15-30 seconds from initial touch to finding a specific individual. Searches requiring more than 45 seconds typically indicate interface friction requiring design adjustment.
Profile Discovery and Engagement
Once visitors locate a specific individual’s profile, their engagement patterns become more deliberate:
- Average dwell time on individual profiles ranges from 45 seconds to 2 minutes
- Visitors read achievement descriptions and view all available photos
- Biography or story content receives surprisingly high engagement when well-written
- Users frequently scroll through photo galleries when multiple images exist
- Social sharing features get used most often by alumni and parents
Interactive profiles that combine photos, achievement lists, statistics, and personal narratives create the deepest engagement during walkthroughs.
Category Browsing Behavior
When visitors explore without specific individuals in mind, category navigation dominates their interaction patterns:
Athletic Category Exploration
Sports content generates particularly engaging browsing experiences:
- Visitors typically select their favorite sport or the sport currently in season
- Team photos attract immediate attention and prompt searches for individual players
- Championship season content receives extended viewing time
- Record boards within sports categories create competitive interest
- Historical team comparisons (current vs. past championship teams) drive engagement
Schools implementing digital trophy displays and recognition walls report that athletic content frequently serves as the entry point leading visitors to explore academic and arts achievements.
Academic and Arts Navigation
Non-athletic achievement categories require equally intuitive navigation:
- Honor society rosters organized by induction year
- Scholarship recipient listings with award details
- Academic competition winners grouped by competition type
- Valedictorian and salutatorian historical records
- Arts performance highlights with production photos
Walkthroughs demonstrate that academic content receives sustained engagement when presented with equal visual quality as athletic achievements.
Timeline and Historical Exploration
One of the most compelling navigation patterns emerges when visitors explore recognition content chronologically:
Year-by-Year Discovery
Timeline-based navigation creates unique engagement opportunities:
- Alumni visitors immediately navigate to their graduation year
- Current students compare present achievements to historical context
- Parents explore the years their children attended
- Community members trace program evolution across decades
- Milestone anniversary years (50th, 100th) receive extended viewing
Interactive school touchscreens that incorporate robust timeline navigation transform recognition displays into historical archives that connect present achievements to program tradition.

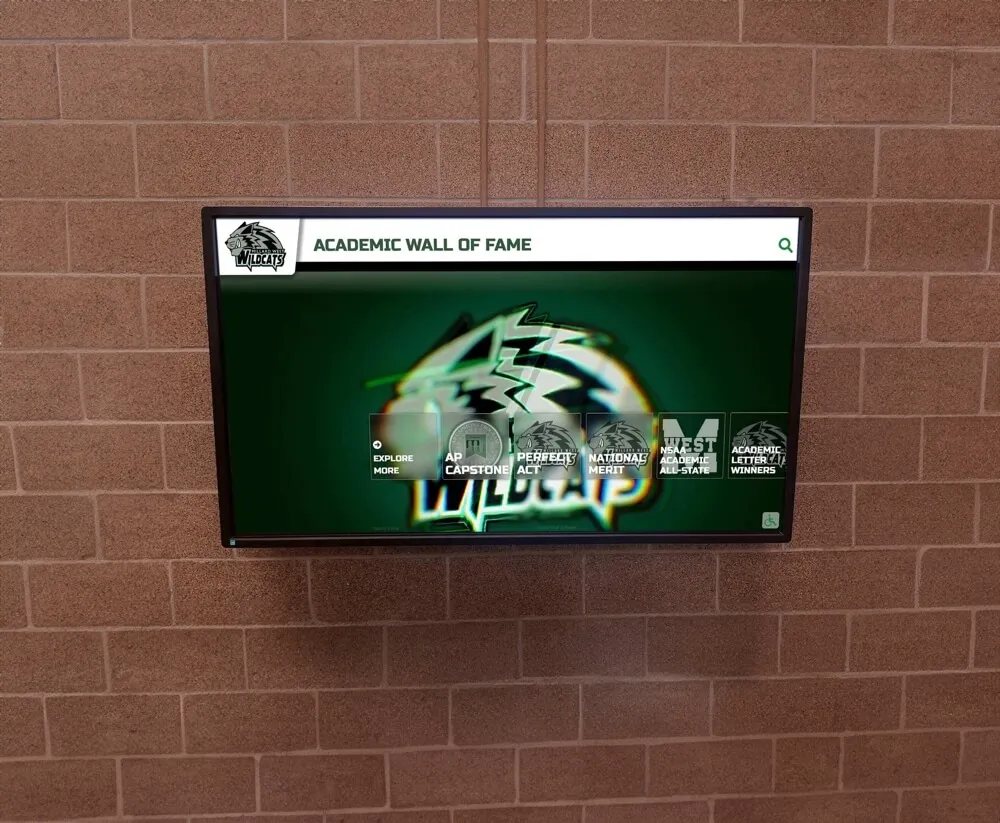
Professional walkthroughs document specific interaction sequences showing how users move through navigation layers and discover content
Real Installation Walkthroughs: Different School Environments
Interactive school touchscreen functionality varies based on installation location, intended audience, and content focus. Walking through displays in different school environments reveals how context shapes both interface design and user interaction patterns.
Athletic Lobby Installations
Touchscreen displays positioned in athletic facilities face unique usage patterns:
Pre-Event Engagement
Before games and competitions, athletic lobby touchscreens see distinctive interaction:
- Visiting team families searching for their athlete’s profile
- Home team supporters reviewing current season statistics
- Alumni athletes revisiting their own historical achievements
- Student athletes showing visiting friends their recognition
- Coaches demonstrating program tradition to recruits
One comprehensive walkthrough at a Midwest high school athletic entrance revealed average engagement times of 3-4 minutes per user group during the hour before game time, with multiple family members crowding around to view athlete profiles together. Schools designing admissions tour experiences with interactive displays report similar extended engagement when tour guides incorporate touchscreen demonstrations.
Post-Event Celebration
After successful competitions, the same displays generate different interaction patterns:
- Immediate gathering around the display to relive game highlights
- Searching for updated statistics reflecting just-completed performances
- Photographing achievement displays for social media sharing
- Comparing current performance to program records
- Celebrating championship additions to historical content
This post-event engagement demonstrates how interactive touchscreens serve both archival and celebratory functions simultaneously.
Main Entrance and Lobby Displays
Touchscreen installations in primary school entrances serve broader audiences with more diverse interests:
First Impression Functions
Main entrance displays create immediate impact for various visitor types:
- Prospective families during school tours exploring academic excellence
- Community members attending evening events discovering school achievements
- Alumni returning for reunions searching for their recognition
- District officials reviewing program accomplishments during visits
- Substitute teachers and guest speakers learning about school culture
A walkthrough at a suburban high school main entrance documented 47 separate user interactions during a typical two-hour evening event, with average engagement times of 2.5 minutes. This usage density demonstrates the broad appeal of well-designed interactive recognition displays.
Comprehensive Content Navigation
Main entrance displays typically feature the most comprehensive content requiring intuitive navigation across diverse achievement categories. Successful installations include:
- Clear top-level navigation distinguishing athletics, academics, arts, and community service
- Search functionality prominently positioned for specific individual discovery
- Featured content rotation highlighting recent achievements across all categories
- Donor recognition integration when displays serve dual purposes
- School history and milestone content accessible but not dominating primary navigation
Effective main entrance displays balance immediate visual impact with deep content exploration capabilities.

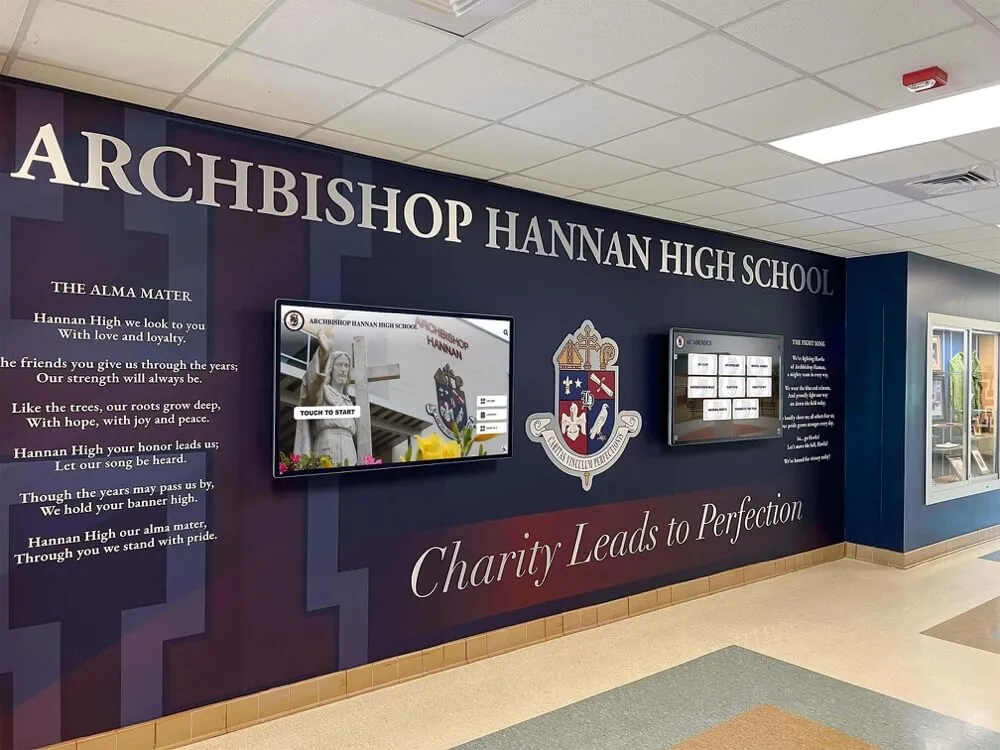
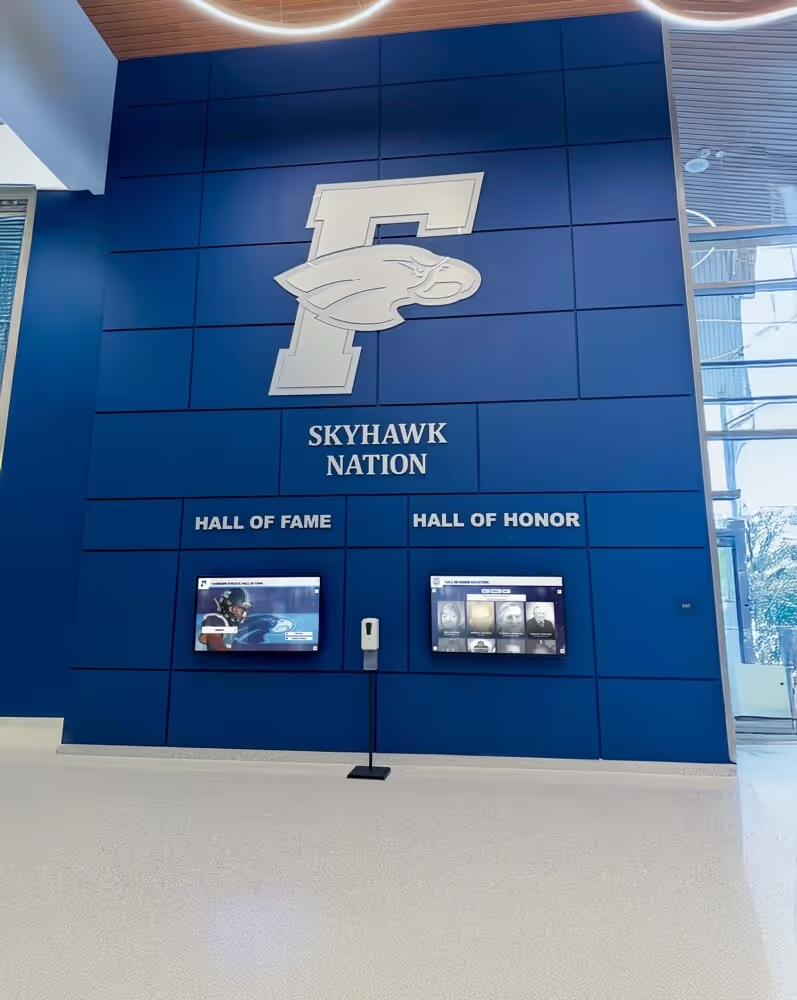
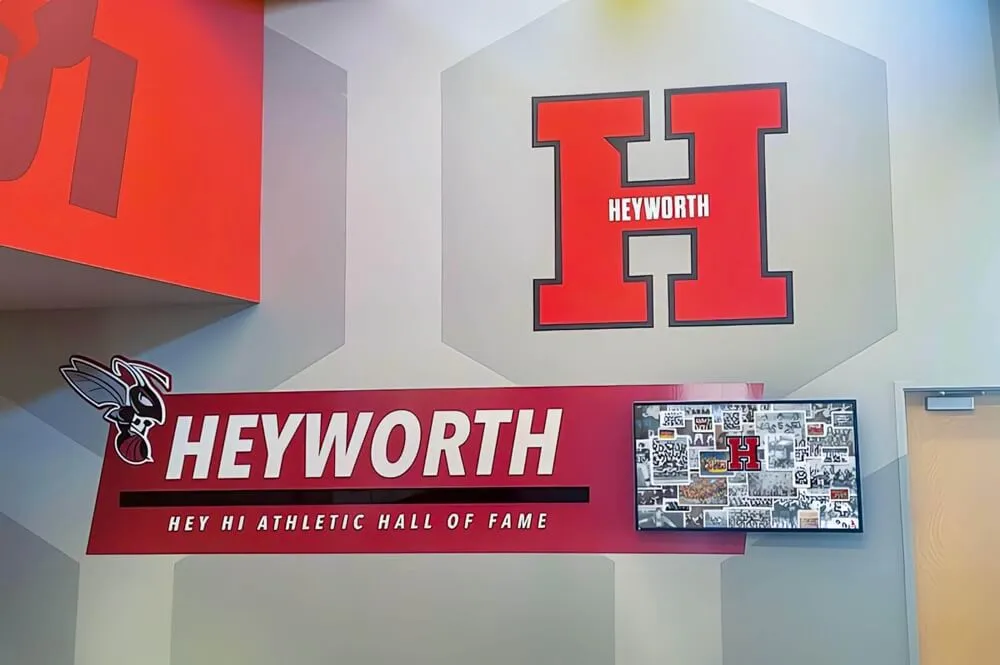
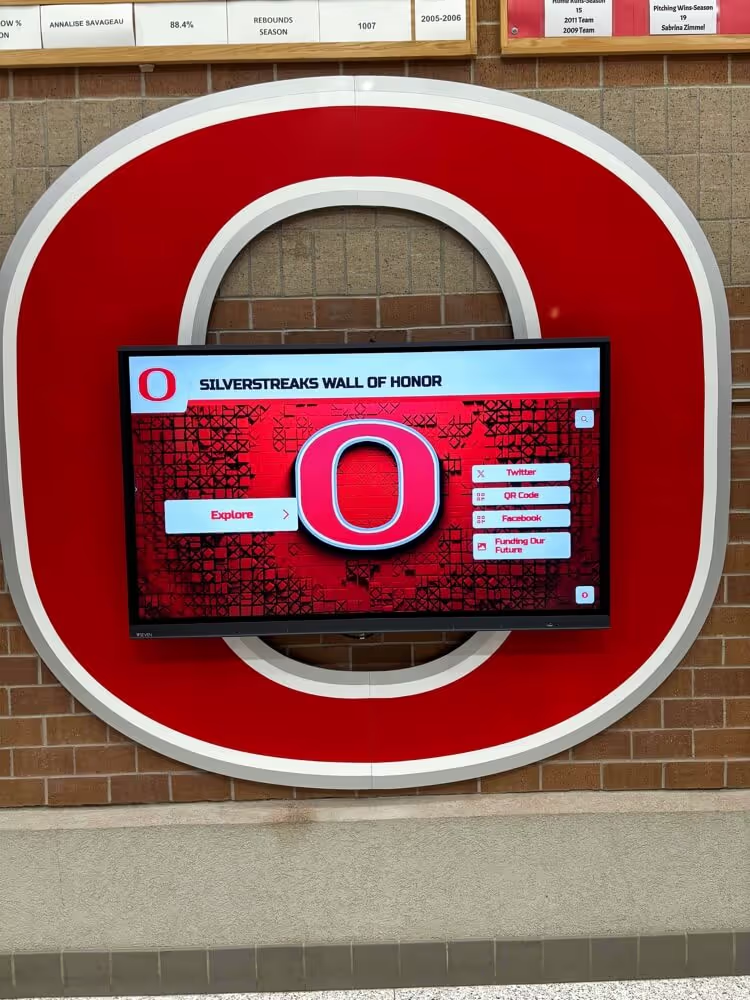
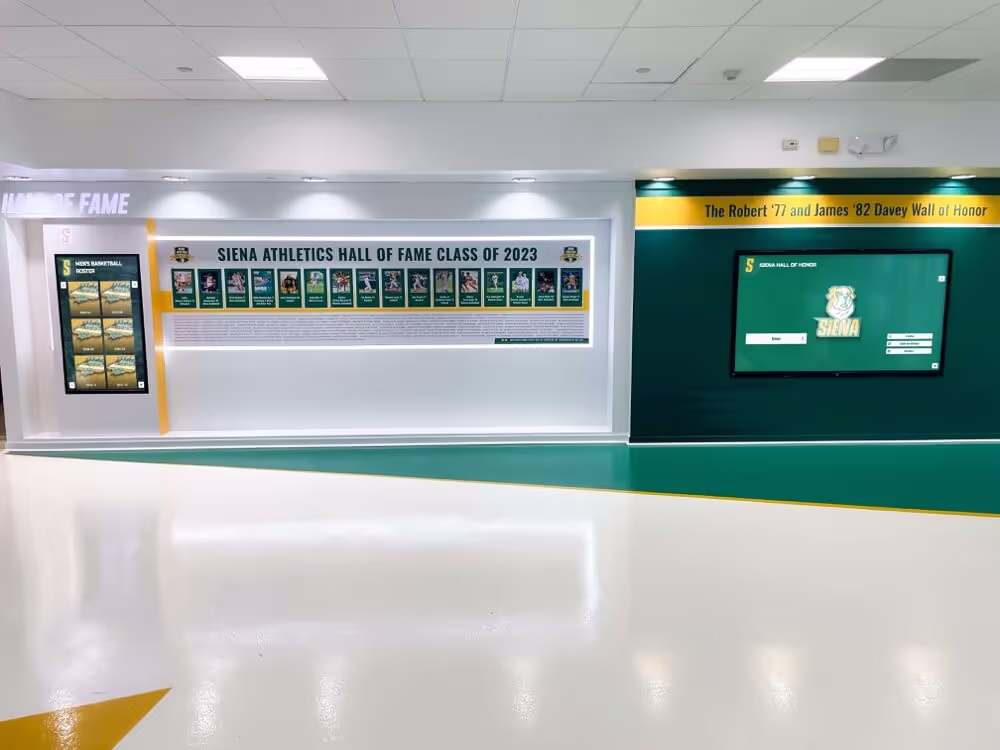
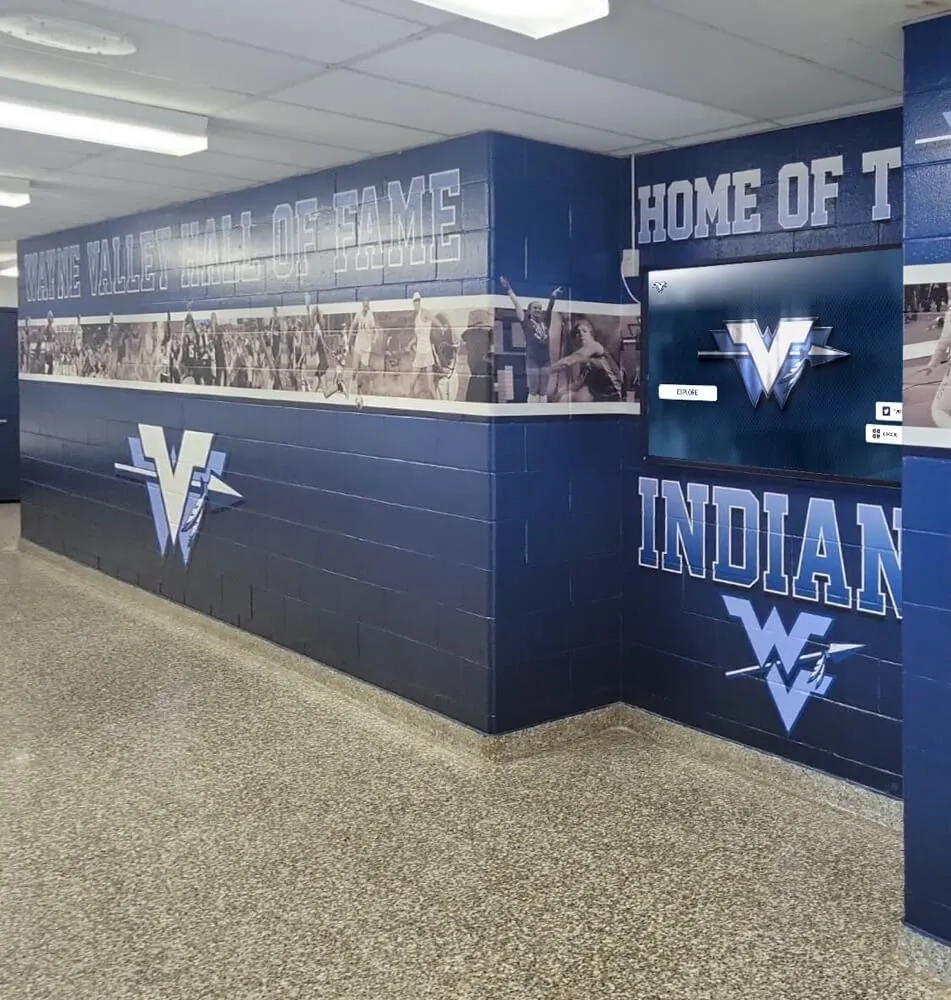
Strategic touchscreen placement within existing recognition environments creates natural interaction opportunities while preserving traditional display elements
Hallway Corridor Installations
Interactive touchscreens positioned in high-traffic hallways face different constraints and opportunities:
Quick Interaction Design
Hallway displays accommodate shorter, more frequent interactions:
- Students passing between classes engaging for 30-60 seconds
- Quick name searches by friends looking for each other’s achievements
- Casual browsing while waiting for activities to begin
- Teacher-led stops during new student building tours
- Maintenance and custodial staff pausing to view community achievements
During one walkthrough analysis, hallway installations averaged 15-20 separate user interactions per hour during school operating hours, with individual engagement times ranging from 20 seconds to 2 minutes. This high-frequency, short-duration usage pattern requires interface design optimized for quick content discovery.
Content Rotation Strategies
Hallway displays benefit from active attract loops between user interactions:
- Featured athlete or scholar rotations changing daily
- Upcoming event promotions and achievement announcements
- Historical “on this day” content connecting to school anniversaries
- Recent achievement highlights automatically cycling
- Call-to-action messaging inviting touch interaction
These attract loop strategies keep displays visually dynamic even when not actively in use, encouraging interaction from passing students and visitors.
Interactive Features That Drive Engagement: Walkthrough Analysis
Observing users interact with various touchscreen features reveals which capabilities genuinely enhance engagement versus which remain largely unused. This analysis comes from documented walkthroughs across dozens of school installations.
Most-Used Interactive Features
Certain touchscreen capabilities consistently generate high usage across all installation types:
Search and Filter Functions
Name search dominates as the single most-used interactive feature:
- Approximately 60-70% of user sessions include at least one name search
- Alumni visitors almost exclusively use search rather than browsing
- Parent users search for their children first, then explore generally
- Search success within 3-5 seconds determines whether users continue engaging
- Advanced filtering by graduation year, sport, or achievement type sees moderate use
The search function essentially serves as the gateway feature that determines whether visitors successfully engage with the full system.
Photo Galleries and Multimedia
Visual content generates the longest sustained engagement:
- Individual profile photo galleries receive 80%+ view rates when multiple photos exist
- Video content embedded in profiles sees 40-50% play rates during walkthroughs
- Photo zoom functionality gets used frequently, especially for team photos
- Historical photos receive extended viewing time as visitors identify individuals
- Slideshow auto-play features see mixed engagement depending on content quality
Interactive school touchscreens that prioritize high-quality visual content create significantly longer average session times compared to text-heavy implementations.

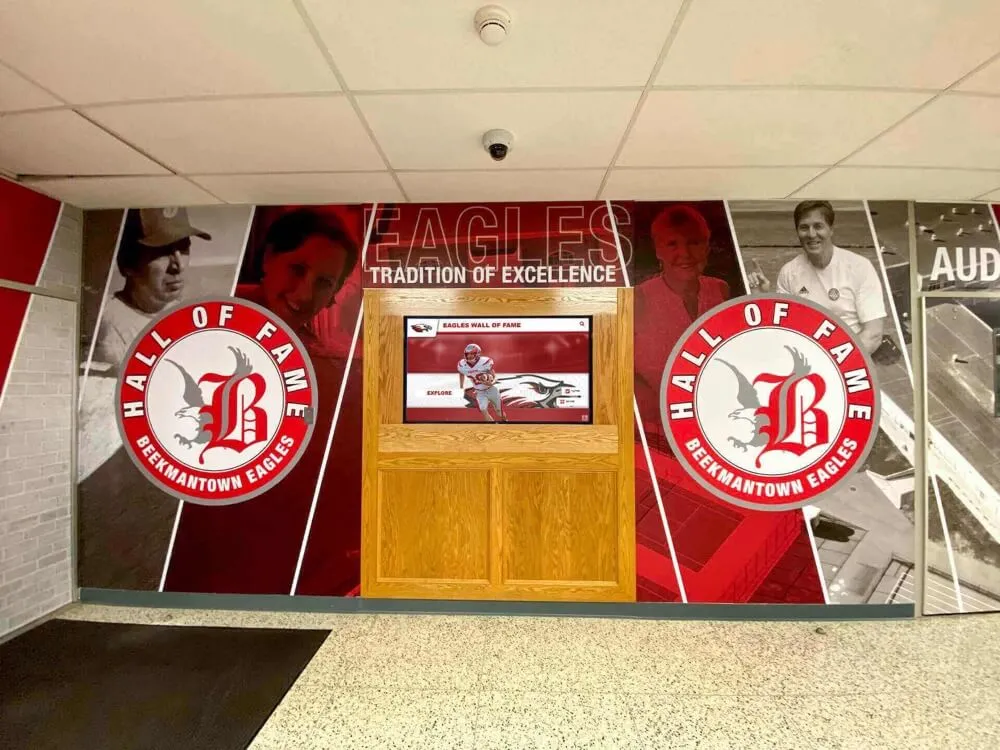
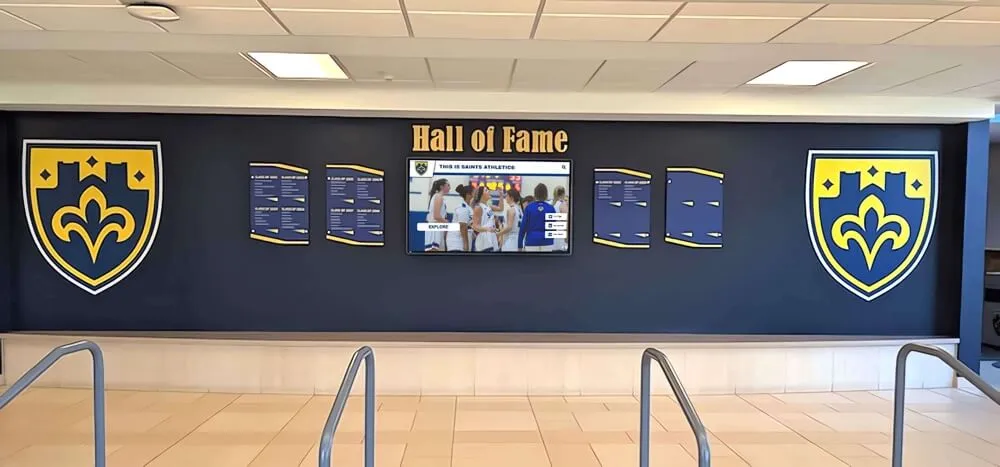
Large-format interactive displays accommodate multiple simultaneous users, enabling group exploration and social sharing of recognition content
Category and Timeline Navigation
After search, category browsing represents the second most common interaction pattern:
Sports Team Navigation
Athletic category navigation follows predictable patterns:
- Current season sports receive 3-5x more engagement than off-season sports
- Championship teams attract disproportionate attention regardless of era
- Individual sport record boards generate competitive comparisons
- Team photos serve as navigation entry points to individual profiles
- Historical rivalries and notable games create engagement peaks
Institutions implementing comprehensive athletic recognition systems report that sport-specific navigation enables deep exploration while maintaining intuitive organization.
Academic Honor Navigation
Non-athletic achievement navigation requires equal attention to user experience:
- National Honor Society rosters organized by induction year
- Academic scholarship recipients grouped by scholarship type
- Distinguished graduate categories with clear selection criteria
- Academic competition results organized by competition and year
- Valedictorian and salutatorian historical listings
Walkthroughs consistently demonstrate that academic content receives engagement proportional to its visual presentation quality and navigational prominence—proving that content hierarchy and design quality matter as much as content type.
Social Sharing and External Integration
Modern interactive touchscreens increasingly include sharing capabilities with varying usage rates:
QR Code Generation for Mobile Access
On-screen QR codes allowing mobile device access show strong adoption:
- QR codes for individual profiles see 20-30% usage during documented walkthroughs
- Alumni and parents most frequently use QR code sharing features
- Mobile access enables extended engagement beyond the physical display
- Share-to-social-media features through QR codes see limited but consistent use
- Email sharing options remain largely unused in school environments
The ability to continue exploring content on personal devices after leaving the physical display extends engagement beyond the initial touchscreen interaction.
Print and Download Functions
Some advanced installations include content download capabilities:
- Profile printing for senior night ceremonies and recognition events
- Achievement certificate generation for award ceremonies
- Photo downloads for family keepsakes (when privacy settings permit)
- Team roster exports for coaching staff and athletic department use
These utility features serve administrative needs as much as visitor engagement, demonstrating how interactive displays can reduce recognition program workload while enhancing visitor experience.
![]()
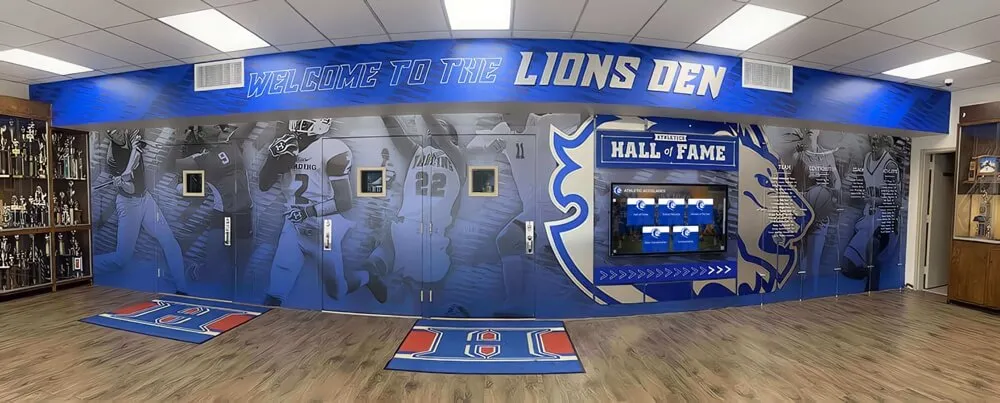
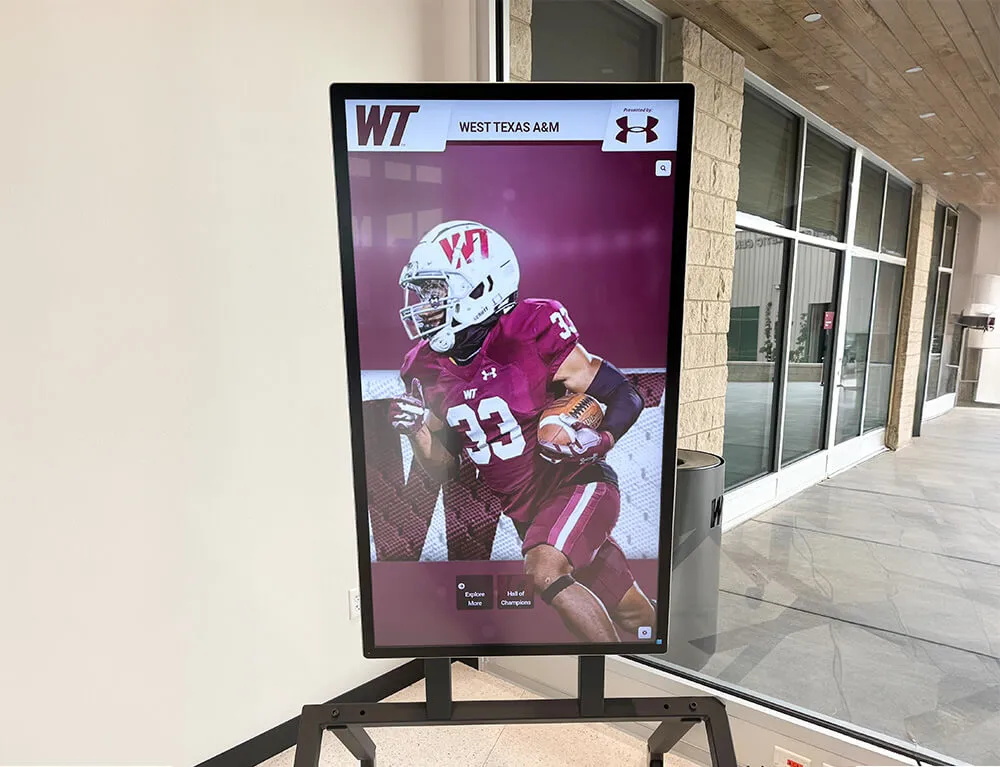
Custom branded interfaces create cohesive visual identity while maintaining intuitive navigation familiar to users of all ages and technology comfort levels
Design Elements That Enhance Walkthrough Experience
Analyzing successful interactive school touchscreen walkthroughs reveals specific design elements that consistently create superior user experiences across different school environments and visitor types.
Visual Hierarchy and Information Architecture
How content appears on screen dramatically affects navigation success during real-world use:
Screen Layout Principles
Effective touchscreen displays employ consistent layout principles:
- Primary navigation occupying the top or left screen edge for immediate visibility
- Content area utilizing 60-70% of screen real estate for generous information display
- Clear visual separation between navigation elements and content display
- Adequate whitespace preventing cluttered appearance that overwhelms users
- Consistent placement of search, home, and back buttons across all screen views
During walkthroughs, users navigate most successfully when interface conventions remain consistent throughout the experience. Navigation confusion typically results from inconsistent button placement or changing interaction patterns between screen views.
Typography and Readability
Text legibility at viewing distances of 1-6 feet requires careful typography choices:
- Minimum 24-point font for body text ensuring readability at arm’s length
- 36-48 point headings creating clear visual hierarchy
- High contrast ratios (minimum 4.5:1) between text and backgrounds
- Sans-serif fonts with generous letter spacing for screen readability
- Limited text density avoiding paragraph blocks exceeding 3-4 lines
Schools implementing interactive kiosk solutions for visitor engagement report that typography adjustments represent one of the most cost-effective improvements for enhancing user experience.
Touch Response and Interaction Feedback
How the system responds to touch dramatically affects perceived quality and usability:
Immediate Response Requirements
Touch responsiveness determines whether interactions feel natural or frustrating:
- Visual response to touch within 100 milliseconds creating instant feedback
- Button state changes (color, shadow, size) confirming successful touch
- Loading indicators for content requiring more than 1 second to display
- Smooth transitions between screens avoiding jarring content changes
- Scrolling responsiveness matching smartphone and tablet expectations
Walkthroughs reveal that visitors subconsciously expect touchscreen responsiveness matching their personal mobile device experience. Systems failing to meet these expectations feel dated and create user frustration.
Error Prevention and Recovery
Design elements that prevent user mistakes improve walkthrough success rates:
- Clearly distinguishable buttons with adequate spacing preventing accidental touches
- Confirmation prompts for potentially disruptive actions (exit search, clear filters)
- Prominent “Back” and “Home” buttons enabling easy navigation recovery
- Breadcrumb trails showing navigation path for complex multi-level structures
- Automatic timeout and return to home screen after 60-90 seconds of inactivity
These design considerations transform potentially frustrating experiences into smooth, confidence-building interactions.

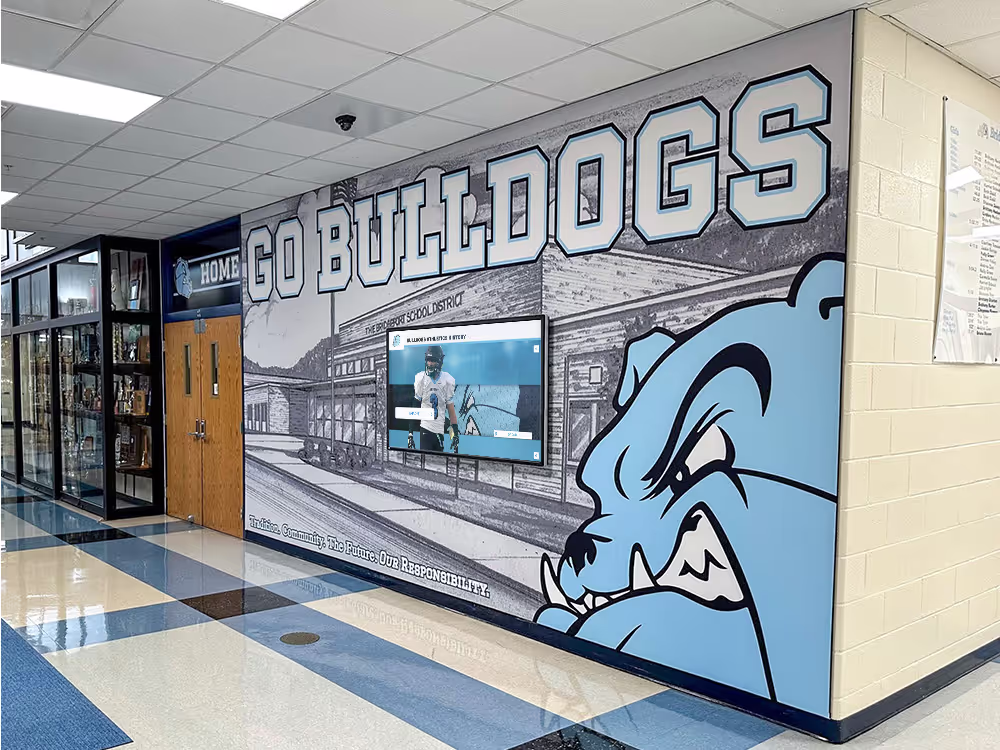
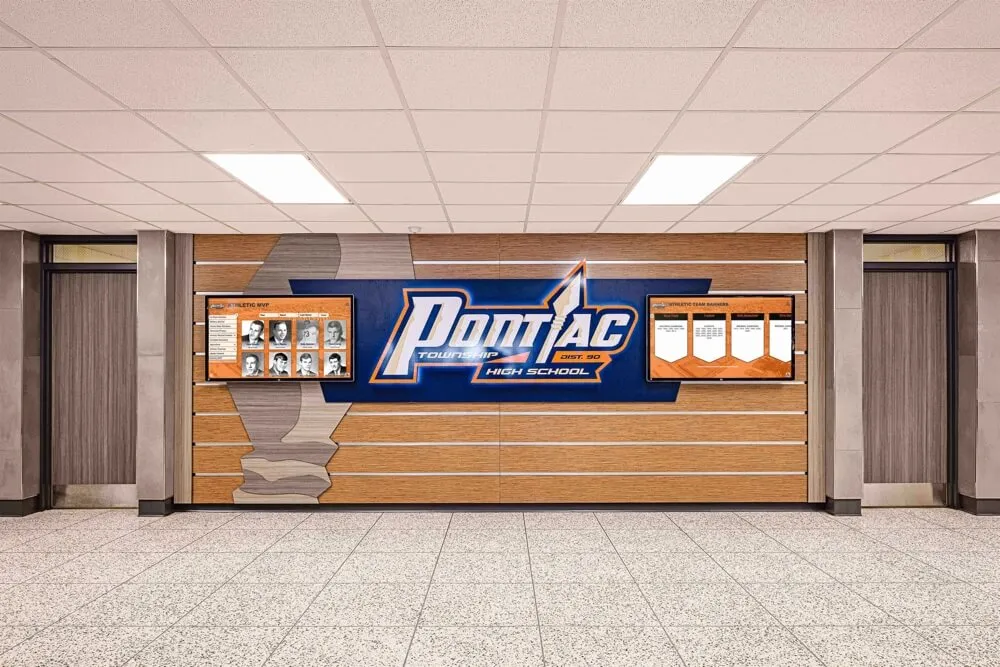
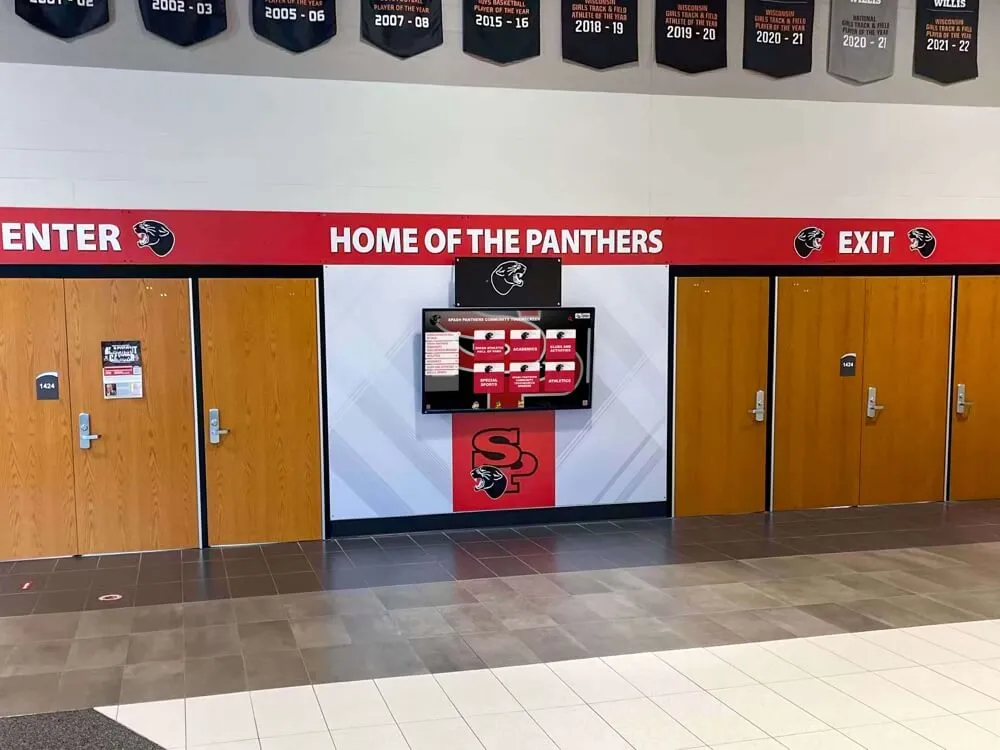
Strategic mounting height and position ensure touchscreen accessibility for users of all heights while maintaining visibility as attractive hallway focal point
Content Management: Behind the Walkthrough Experience
The user experience during touchscreen walkthroughs depends entirely on the content management capabilities supporting the display. Understanding how content gets updated, organized, and maintained reveals the operational reality behind successful interactive installations.
Content Update Workflows
The frequency and ease of content updates directly impact whether displays remain current and relevant:
Real-Time Update Capabilities
Modern interactive school touchscreens enable immediate content publication:
- Cloud-based content management systems allowing updates from any internet-connected device
- Immediate synchronization between CMS edits and display content (typically under 5 minutes)
- Draft and preview capabilities enabling content review before publication
- Scheduled publishing for timed releases (season announcements, award ceremonies)
- Bulk upload functionality for adding entire teams or graduating classes efficiently
Schools utilizing comprehensive archival and recognition software report update workflows requiring 5-10 minutes for typical additions like new award recipients or updated statistics, compared to days or weeks for traditional physical displays.
Content Organization Systems
Behind-the-scenes organization determines navigation efficiency:
- Hierarchical category structures matching how users naturally browse
- Tagging and metadata systems enabling powerful filtering and search
- Relationship mapping connecting individuals to teams, years, achievements
- Asset management for photos, videos, and documents linked to profiles
- Version control tracking content changes and enabling rollback when needed
Effective content organization creates the foundation for intuitive user navigation during walkthroughs.
Quality Control and Consistency
Maintaining professional presentation across hundreds or thousands of individual profiles requires systematic quality standards:
Photo and Image Standards
Visual consistency elevates perceived quality:
- Minimum resolution requirements ensuring clarity on large displays
- Aspect ratio guidelines creating uniform appearance across profiles
- Background and lighting standards for individual portraits
- Action photo selection criteria emphasizing engagement moments
- Historical photo restoration improving visual quality of archival content
During walkthroughs, visual inconsistency between profiles creates noticeable quality drops that undermine overall impression. Consistent photo standards prove essential for professional presentation.
Content Completeness Requirements
Profile depth varies, but minimum content standards maintain quality:
- Required fields ensuring all profiles include essential information
- Optional enhancement fields enabling exceptional profiles for major achievements
- Character count guidelines preventing excessive or insufficient text length
- Data validation preventing incomplete or malformed information
- Placeholder management for profiles awaiting complete information
These content standards ensure that every individual receives dignified recognition while enabling enhanced presentation for particularly notable achievements.
Measuring Walkthrough Success: Analytics and Usage Data
Interactive school touchscreens generate usage analytics revealing exactly how visitors engage with recognition content. These metrics inform ongoing improvements and demonstrate return on investment.
Interaction Analytics
Modern touchscreen systems track detailed usage patterns:
Engagement Metrics
Quantitative data demonstrates actual visitor behavior:
- Total unique user sessions measuring overall usage volume
- Average session duration indicating depth of engagement
- Most-viewed content identifying high-interest profiles and categories
- Search query analysis revealing what visitors seek
- Navigation path tracking showing how users move through content
- Time-of-day usage patterns identifying peak engagement periods
One high school reported average monthly statistics of 840 unique user sessions with 2.3-minute average duration and 4.7 content items viewed per session—demonstrating substantial ongoing engagement with their interactive recognition display.
Content Performance Analysis
Understanding which content generates engagement informs future additions:
- Most frequently accessed individual profiles
- Category usage distribution (athletics vs. academics vs. arts)
- Historical content engagement compared to recent additions
- Media consumption rates (photo views, video plays)
- Search success rates and failed search queries
- Feature utilization (filters, timelines, sharing functions)
This performance data enables continuous improvement of both content and interface design based on actual user behavior rather than assumptions.
Return on Investment Indicators
Beyond engagement metrics, successful implementations demonstrate broader value:
Operational Efficiency Gains
Interactive displays reduce recognition program workload:
- Elimination of physical plaque ordering and installation for new achievements
- Reduction in recognition ceremony preparation time through automated displays
- Decreased response time to recognition update requests
- Streamlined content workflows replacing manual updates
- Reduced storage requirements for recognition archives and records
Community Impact Measures
Qualitative indicators complement quantitative metrics:
- Increased family attendance at recognition events and school functions
- Enhanced alumni engagement and return visit rates
- Improved prospective family impressions during admissions tours
- Greater student awareness of school achievement traditions
- Strengthened community pride in school accomplishments
Schools implementing comprehensive interactive recognition report that community response and program awareness represent the most significant returns, with operational efficiency following as important secondary benefit.
Implementation Considerations: From Planning to Walkthrough-Ready
Transforming an empty wall into an engaging interactive school touchscreen experience requires careful planning across multiple dimensions. Understanding the implementation process helps administrators set realistic expectations and ensure successful deployment.
Technical Infrastructure Requirements
Before any walkthrough can occur, installations require proper technical foundation:
Hardware Specifications
Essential equipment components include:
- Commercial-grade touchscreen display (55-65 inches for most applications)
- Dedicated media player or integrated computing solution
- Reliable internet connectivity (wired connection preferred)
- Proper electrical service with surge protection
- Secure mounting hardware appropriate for wall construction
- Optional peripherals (speakers, ambient lighting, accessibility features)
Quality hardware selections determine both initial user experience and long-term reliability. Commercial-grade components designed for continuous operation prove essential for school environments with heavy usage.
Network and Software Infrastructure
Beyond physical hardware, successful implementations require:
- Stable network connectivity supporting content synchronization
- Cloud-based content management system with appropriate user permissions
- Integration capabilities with existing school data systems when desired
- Remote monitoring and troubleshooting access for technical support
- Automated backup systems protecting content from loss
- Security protocols preventing unauthorized access or content modification
These backend systems remain invisible during walkthroughs but prove essential for ongoing operation.
Content Development Processes
Launching with compelling content requires systematic development:
Initial Content Migration
Most schools possess substantial existing recognition content requiring digitization:
- Historical achievement records from physical plaques and programs
- Existing digital photo archives from yearbooks and athletic departments
- Athletic statistics from record books and coaching records
- Academic honor roll data from student information systems
- Arts performance records and production documentation
The initial content development typically represents the largest project task, requiring 20-50 hours depending on historical depth and existing digital asset organization.
Ongoing Content Workflows
After launch, sustainable content addition processes maintain currency:
- Designated staff roles for content creation and approval
- Defined workflows for different content types (new athletes, awards, achievements)
- Quality standards ensuring consistency across additions
- Approval processes maintaining accuracy and appropriateness
- Regular audit schedules verifying content remains current
Schools report that ongoing content maintenance requires 2-5 hours per month after establishment of efficient workflows.
Conclusion: Making Interactive Touchscreens Work in Your School
Observing interactive school touchscreens through comprehensive walkthroughs reveals both their tremendous potential and the critical success factors that separate engaging installations from underutilized technology. Real-world usage patterns demonstrate that thoughtfully designed recognition displays create sustained community engagement far exceeding traditional static approaches.
The most successful implementations share common characteristics: intuitive navigation requiring no training, visually compelling content inviting exploration, comprehensive achievement coverage spanning athletics and academics equally, and responsive performance matching modern mobile device expectations. When these elements combine effectively, touchscreen displays transform from novelty installations into central recognition platforms that connect current students to school tradition while creating lasting community pride.
For administrators evaluating interactive touchscreen options, the walkthrough perspective proves invaluable. Rather than reviewing feature lists and specifications alone, consider requesting demonstrations showing actual user navigation, search functionality, content organization, and the complete visitor experience from first touch through content discovery. The system’s effectiveness during these realistic demonstrations predicts its long-term success in your school environment far more accurately than any technical documentation.
Interactive recognition represents an investment in community building and institutional memory preservation. By prioritizing user experience, content quality, and operational sustainability, schools create digital archives that serve current recognition needs while building permanent records celebrating achievement for generations to come.
Ready to see how interactive touchscreen recognition could work in your school environment? Request a personalized demo walkthrough showing actual navigation, content display, and engagement features tailored to your specific recognition programs and institutional traditions.